
Understanding the Laffer Curve
Unlocking the Mysteries of the Laffer Curve: Taxation and Government Revenue
The world of economics is rife with theories, graphs, and equations that attempt to decipher the intricate dance between government taxation and revenue generation. One such concept that has captured the imagination of policymakers, economists, and the general public alike is the Laffer curve. This theoretical curve offers a fascinating perspective on how tax rates influence government tax revenue. In this blog post, we’ll explore the Laffer curve, its origins, implications, and real-world applications.
The Laffer Curve Unveiled
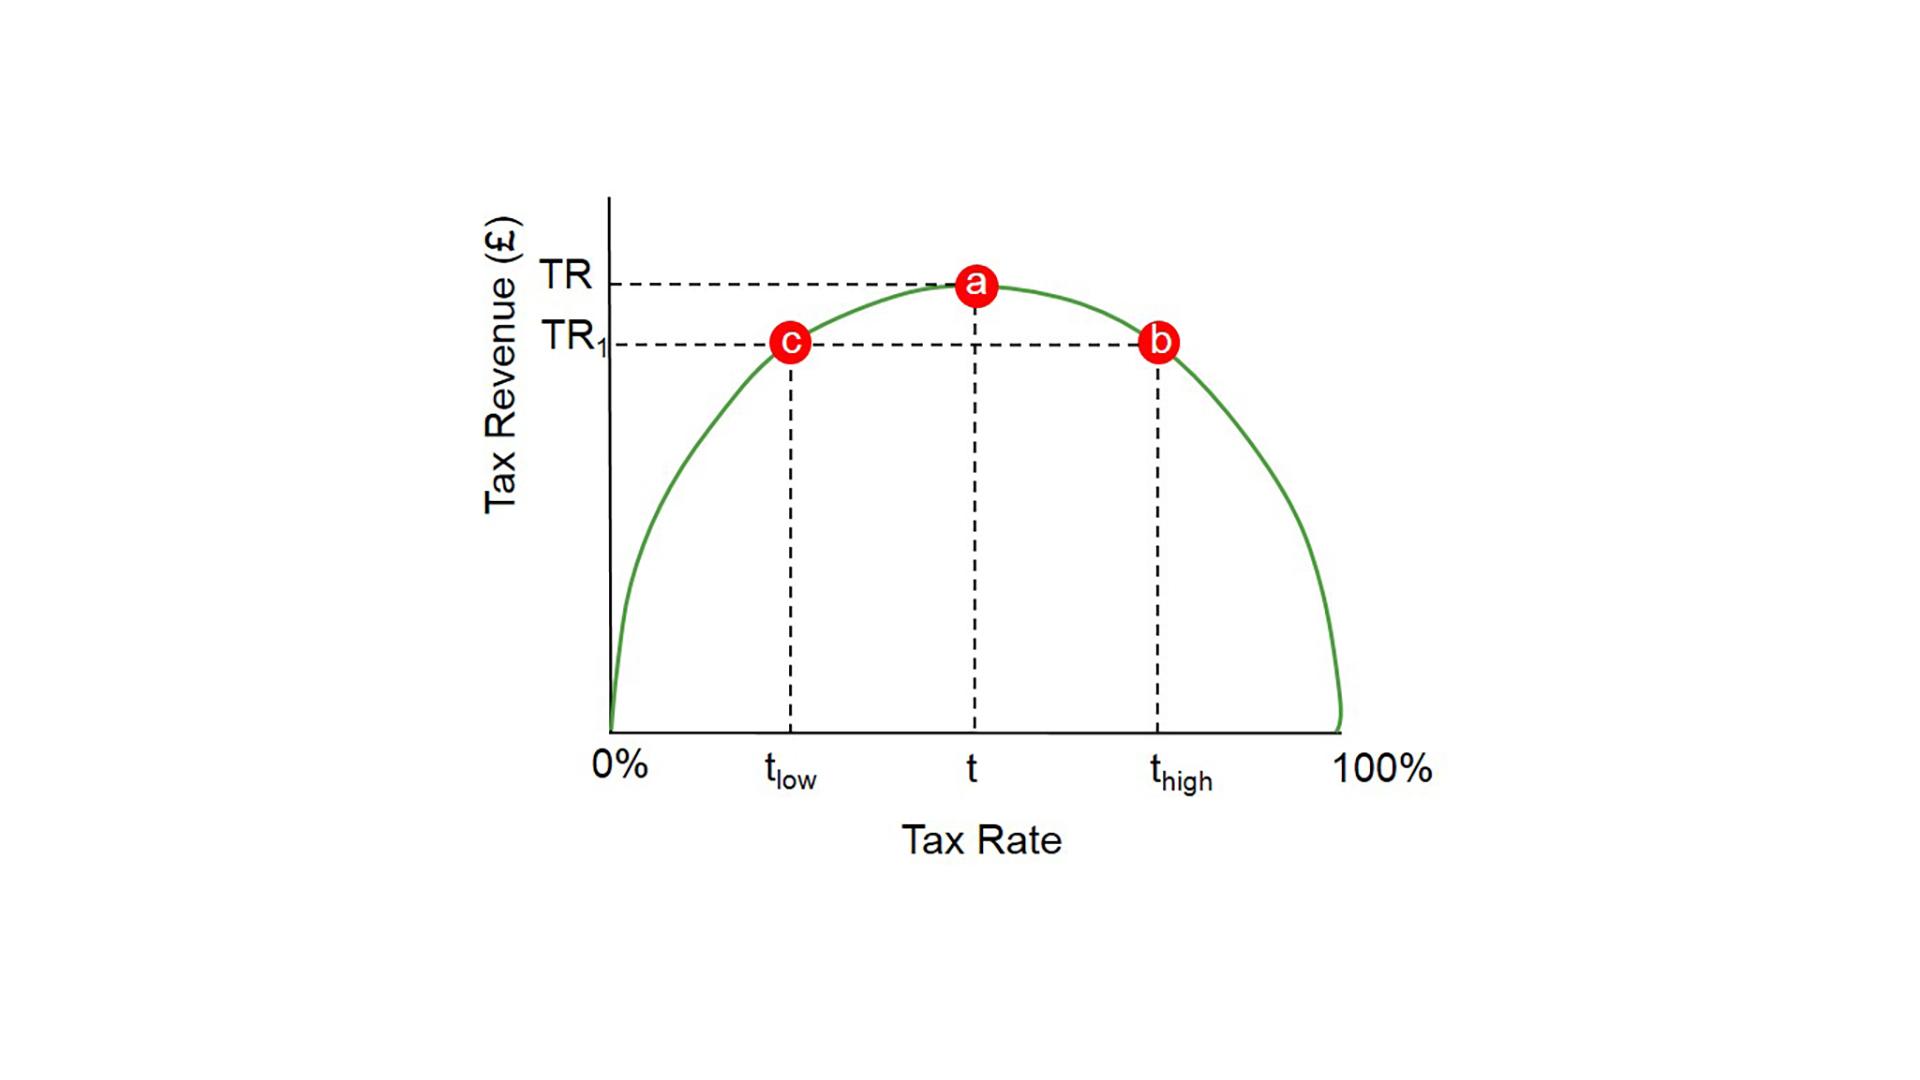
The Laffer curve, named after supply-side economist Arthur Laffer, is a graphical representation of the relationship between tax rates and government tax revenue. At its core, it suggests that there exists an optimal tax rate that maximizes government revenue. According to the Laffer curve, tax revenue is nil at both the extreme tax rates of 0% and 100%. Hence, there must be a sweet spot somewhere between these two extremes where tax revenue reaches its zenith.
The curve’s shape is intricately linked to the concept of taxable income elasticity. In simpler terms, it means how people respond to changes in tax rates. Laffer’s representation typically begins at a 0% tax rate, yielding zero revenue, gradually climbs to a point where tax revenue peaks, and then descends again to zero at a 100% tax rate. However, it’s important to note that the exact shape of the curve remains a point of contention among economists.
The Implications of the Laffer Curve
One significant implication of the Laffer curve is that increasing tax rates beyond a certain point becomes counterproductive for raising more tax revenue. This concept has been particularly influential in the United States, where conservatives have used it to argue that lower taxes can, paradoxically, lead to higher tax revenue. Nevertheless, it’s important to highlight that determining the precise maximum revenue point on the Laffer curve for any specific market is a challenging task, often fraught with controversy. Estimates of revenue-maximizing income tax rates have varied widely, with a mid-range estimate of around 70%.
A Napkin and a Meeting: The Birth of the Laffer Curve
The Laffer curve gained notoriety in the United States during an afternoon meeting in 1974, attended by Arthur Laffer, Dick Cheney, Donald Rumsfeld, and others from the Ford Administration. Legend has it that Laffer sketched the curve on a napkin to illustrate his argument against President Gerald Ford’s proposed tax increase. The term “Laffer curve” was coined by Jude Wanniski, who was also present at the meeting. However, it’s worth noting that the basic idea of the Laffer curve was not entirely novel, with roots traced back to thinkers like the 14th-century social philosopher Ibn Khaldun and economists like John Maynard Keynes and Adam Smith.
Historical Precedents and Controversy
The Laffer curve is not without historical precedents. Figures like Andrew Mellon, the Secretary of the Treasury in the 1920s, advocated for tax cuts as a means to boost revenue. Mellon’s approach, reducing the top income tax bracket from 73% to 24%, was met with success, as personal income tax receipts increased significantly during his tenure.
However, the Laffer curve’s real-world applicability remains a subject of debate. A 2012 survey of economists found that the majority rejected the idea that tax cuts would lead to increased revenue, especially in the context of federal US income taxes.
Empirical Analysis and Revenue Maximization
One practical use of the Laffer curve is to determine the tax rate that maximizes government revenue. This rate should not be confused with the optimal tax rate, which seeks to raise revenue with minimal economic distortion. Various studies have estimated revenue-maximizing tax rates, with results often clustering around 70%.
Beyond Income Tax: Goods and Services
The Laffer curve’s principles have been extended to the taxation of goods and services. Recent research has emphasized the importance of considering firms’ strategic pricing responses in non-competitive markets when estimating the Laffer curve. This can impact the revenue-maximizing tax rate and its location.
Congressional Budget Office Analysis
In 2005, the United States Congressional Budget Office analyzed the economic and budgetary effects of a 10% cut in income tax rates. Their findings suggested that, even in generous growth scenarios, only a fraction of the lost revenue would be recouped over a decade. This means that deficits would increase significantly after a tax cut, offsetting the benefits.
The UK Perspective
In the United Kingdom, the reduction of the top income tax rate from 50% to 45% in 2013 sparked a debate on the Laffer curve. The HMRC estimated the cost of this tax reduction, suggesting that the UK was potentially near the peak of the Laffer curve.
In conclusion, the Laffer curve serves as a thought-provoking concept that highlights the intricate relationship between tax rates and government revenue. While it has been influential in policy discussions, its real-world applicability remains a topic of debate among economists. Understanding the Laffer curve can provide valuable insights into tax policy decisions, but its complexities should always be considered in context.